How to Read a Balance Sheet: A Walkthrough With Numbers
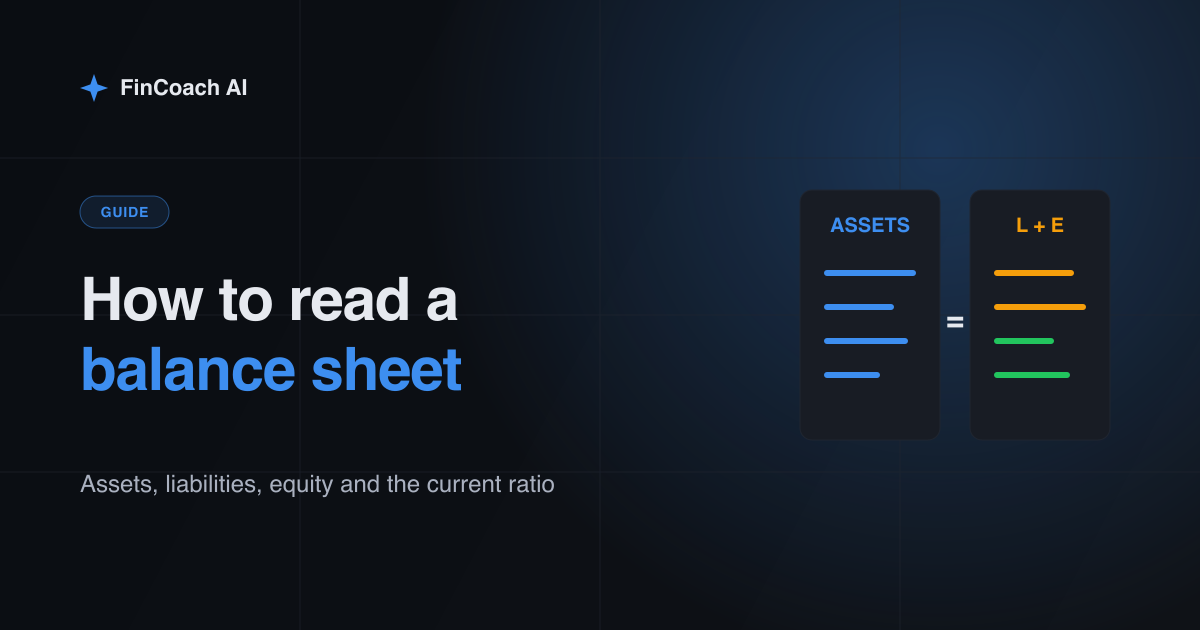
To read a balance sheet, start from the equation it always obeys: assets equal liabilities plus shareholders’ equity. Then ask three questions in order: can the company pay what it owes in the next twelve months, how much debt sits behind the business, and how much of the equity is made of things you could sell.
The balance sheet is a snapshot of one day, usually the last day of the quarter or fiscal year. The income statement tells you what happened over a period; the balance sheet tells you where the company stood when the period closed. A worked example further down reads a hypothetical balance sheet line by line.
What does a balance sheet show?
It shows what a company owns, what it owes, and what is left for shareholders. The SEC’s Beginners’ Guide to Financial Statements defines the three parts plainly: assets are “things that a company owns that have value”, liabilities are “amounts of money that a company owes to others”, and equity is the money that would be left if the company sold all its assets and paid off all its liabilities.
Because equity is defined as the leftover, the two sides always match. If a company borrows $100 million and keeps it as cash, assets and liabilities both rise by $100 million and equity doesn’t move. If it loses money, equity shrinks. Read the statement with that mechanic in mind and most of the line items stop looking arbitrary.
US-listed companies publish a balance sheet in every 10-Q and 10-K, inside Item 8 of the annual report. Both are free on the SEC’s EDGAR search. Companies show at least two dates side by side, so you can see what changed over the year.
What is the difference between current and noncurrent items?
Current items turn into cash, or have to be paid, within about a year; noncurrent items take longer. The SEC guide says current assets are things a company expects to convert to cash within one year, and current liabilities are obligations it expects to pay off within the year.
- Current assets: cash and equivalents, short-term investments, accounts receivable (customers who owe money), inventory and prepaid expenses.
- Noncurrent assets: property, plant and equipment, long-term investments, intangible assets and goodwill.
- Current liabilities: accounts payable (bills owed to suppliers), accrued expenses, short-term debt and the part of long-term debt due within a year.
- Noncurrent liabilities: long-term debt, lease liabilities, pension obligations and deferred taxes.
The split matters because the next twelve months are where companies get into trouble. A business with valuable factories can still miss a payment if most of its cash is tied up in inventory and a loan comes due in March.
How do you check short-term liquidity?
Compare current assets with current liabilities, two ways. Working capital is current assets minus current liabilities, the formula the SEC guide gives. The current ratio divides the same two numbers: current assets ÷ current liabilities, as Corporate Finance Institute and most textbooks define it.
A current ratio of 1.5 means $1.50 of short-term assets for every dollar due within a year. Below 1.0, the company needs incoming cash, new borrowing or a supplier’s patience to cover the gap. That isn’t automatically bad: some retailers and software companies collect cash before they pay suppliers and run below 1.0 for years. Compare the ratio with the company’s own history and with close competitors before reading anything into it.
Inventory is the weak spot in the current ratio, because it has to be sold before it becomes cash. Some analysts strip it out and divide only cash, short-term investments and receivables by current liabilities, a stricter version usually called the quick ratio. If the current ratio looks fine but the quick ratio is far lower, the company is counting on selling what sits in its warehouses.
How much debt is on the balance sheet?
Add every line that carries interest: short-term borrowings, the current portion of long-term debt, and long-term debt. Lease liabilities are often listed separately, and whether you count them depends on what you’re comparing, so use the same choice across years and companies.
Then subtract cash and short-term investments to get net debt, the amount the company couldn’t repay today from its own cash. The SEC guide’s debt-to-equity ratio uses total liabilities instead (total liabilities ÷ shareholders’ equity), so a ratio of 2 means two dollars of liabilities for every dollar of equity. Both versions are common, which is why you should always check which one a data site uses. The debt-to-equity guide covers the ratio, interest coverage and maturity schedules in detail.
What should you look for in equity?
Shareholders’ equity has a few parts: paid-in capital from share issues, retained earnings (profits kept rather than paid out), treasury stock (shares the company bought back, shown as a negative number) and accumulated other comprehensive income. Retained earnings that rise year after year mean the company is profitable and keeping some of it.
Two things distort the total. Large buybacks shrink equity, and a company that has repurchased heavily can show small or even negative equity while running a healthy business, which makes ratios built on equity hard to read. Goodwill, the premium paid for past acquisitions above the fair value of what was bought, can make equity look larger than anything you could sell. Subtract goodwill and other intangibles to see tangible equity; if that number is close to zero or negative, the book value rests on past deals working out.
A worked example: Harbor Tools (hypothetical)
Harbor Tools is a fictional maker of power tools. Its year-end balance sheet, in millions of dollars:
- Current assets: cash $120, receivables $90, inventory $150. Total $360.
- Noncurrent assets: property and equipment $400, goodwill $140. Total $540.
- Total assets: $900.
- Current liabilities: payables $110, accrued expenses $30, short-term debt $60. Total $200.
- Noncurrent liabilities: long-term debt $300, other $100. Total $400.
- Total liabilities: $600. Shareholders’ equity: $300. Check: $600 + $300 = $900.
Working capital is $360 − $200 = $160 million, and the current ratio is $360 ÷ $200 = 1.8. Without inventory, the quick ratio is ($120 + $90) ÷ $200 = 1.05, so Harbor can cover the next year’s bills without selling a single tool, but only just.
Interest-bearing debt is $60 + $300 = $360 million. Net of cash, that’s $240 million. Debt-to-equity is 2.0 on the SEC’s total-liabilities definition ($600 ÷ $300) and 1.2 counting only borrowings ($360 ÷ $300). Tangible equity is $300 − $140 = $160 million, so almost half of the book value is goodwill from acquisitions.
None of these numbers is alarming alone. The questions they raise are specific: why inventory is larger than cash and receivables combined, when the $300 million of long-term debt matures (the debt footnote has a schedule), and whether the acquisitions behind the goodwill are earning their keep.
What does the balance sheet not tell you?
It doesn’t show whether the company is making money or generating cash. A strong balance sheet can be running down while losses eat the cash pile, so read it next to the income statement and the cash flow statement. The free cash flow guide shows how to read the cash side.
Assets are also mostly recorded at historical cost, minus depreciation. A building bought in 1995 may be worth far more than its book value, and a brand built over decades usually appears nowhere, because internally created brands aren’t capitalized. The footnotes explain how each line was measured, and Item 7, management’s discussion of liquidity and capital resources, explains how the company plans to fund itself.
How FinCoach AI reads the balance sheet
The Analyze stock screen in FinCoach has a “Balance sheet & debt analysis” section for any ticker you enter. It runs four checks, each with a risk level and a short note:
- Net cash: cash plus marketable securities minus all debt.
- Debt structure: the share of debt that is short-term, and fixed versus variable rates.
- D/E ratio: debt divided by shareholders’ equity.
- Crisis test: the pre-tax profit margin under pricing pressure.
The Stock Radar detail page lists the current ratio among its key ratios, next to EV/EBITDA, EV/Sales and beta, with five years of annual financials and a quarterly drill-down. Fundamentals come from Financial Modeling Prep, and Claude writes the notes. The section’s “Ask AI” box answers questions using only that section’s data. It reads the reported numbers and can be wrong; it doesn’t read every footnote, so check a figure against the 10-K before you rely on it.
Keep reading
- Debt-to-equity ratio: how to check a company’s debt
- How to calculate free cash flow
- How to read an earnings report
- How to analyze a stock: a six-question method
Educational, not financial advice. FinCoach AI is not a broker or investment adviser, and AI output can be wrong; check anything important before you act. Figures as of 22 November 2026; sources linked.
Open the balance sheet section for a ticker you follow. Launch the app.
Launch appFrequently asked questions
What is a good current ratio?
There is no single good number. Many industrial companies sit between 1 and 2, while some retailers and subscription businesses run below 1 because they collect cash before paying suppliers. Compare a company with its own history and its closest competitors.
Why do both sides of a balance sheet always match?
Shareholders’ equity is defined as assets minus liabilities, so the equation assets equal liabilities plus equity holds by construction. Every transaction changes at least two lines so the totals stay equal.
Where can I find a company’s balance sheet for free?
US-listed companies include it in their 10-K annual report and 10-Q quarterly reports, which are free on the SEC’s EDGAR website. Most companies also post them on the investor relations page of their own website.
Can a profitable company have negative equity?
Yes. Large share buybacks or dividends funded with debt can push shareholders’ equity below zero even when the business earns steady profits. Ratios built on equity, such as debt-to-equity and return on equity, stop being meaningful in that case.
What is goodwill on a balance sheet?
Goodwill is the amount a company paid for acquisitions above the fair value of the identifiable assets it bought. It can’t be sold separately, so many analysts subtract it to see tangible equity.
This article is for educational and informational purposes only and is not financial, investment, tax or legal advice. FinCoach AI is not a broker or registered investment adviser. Investing involves risk, including the possible loss of capital. Do your own research and consider a licensed professional before acting. See our Terms.